This week I had to make a panel with results from 5 different brms models in R. The ggplot2 allows you to do facet_wraps to create a panel with multiple plots but it also requires that you have a well formated dataframe.
brms provides some functions to create conditional effects plots. The plots are ready and can be easily customized with ggplot2. While the package offers functions to retrieve the data frame, I did not want to recreate the plots. They were already fine.
As a solution comes the excelent package patchwork. This package allows you to place plots in a grid with many customizations.
In this post, I will walk through the steps to make the final figure below:
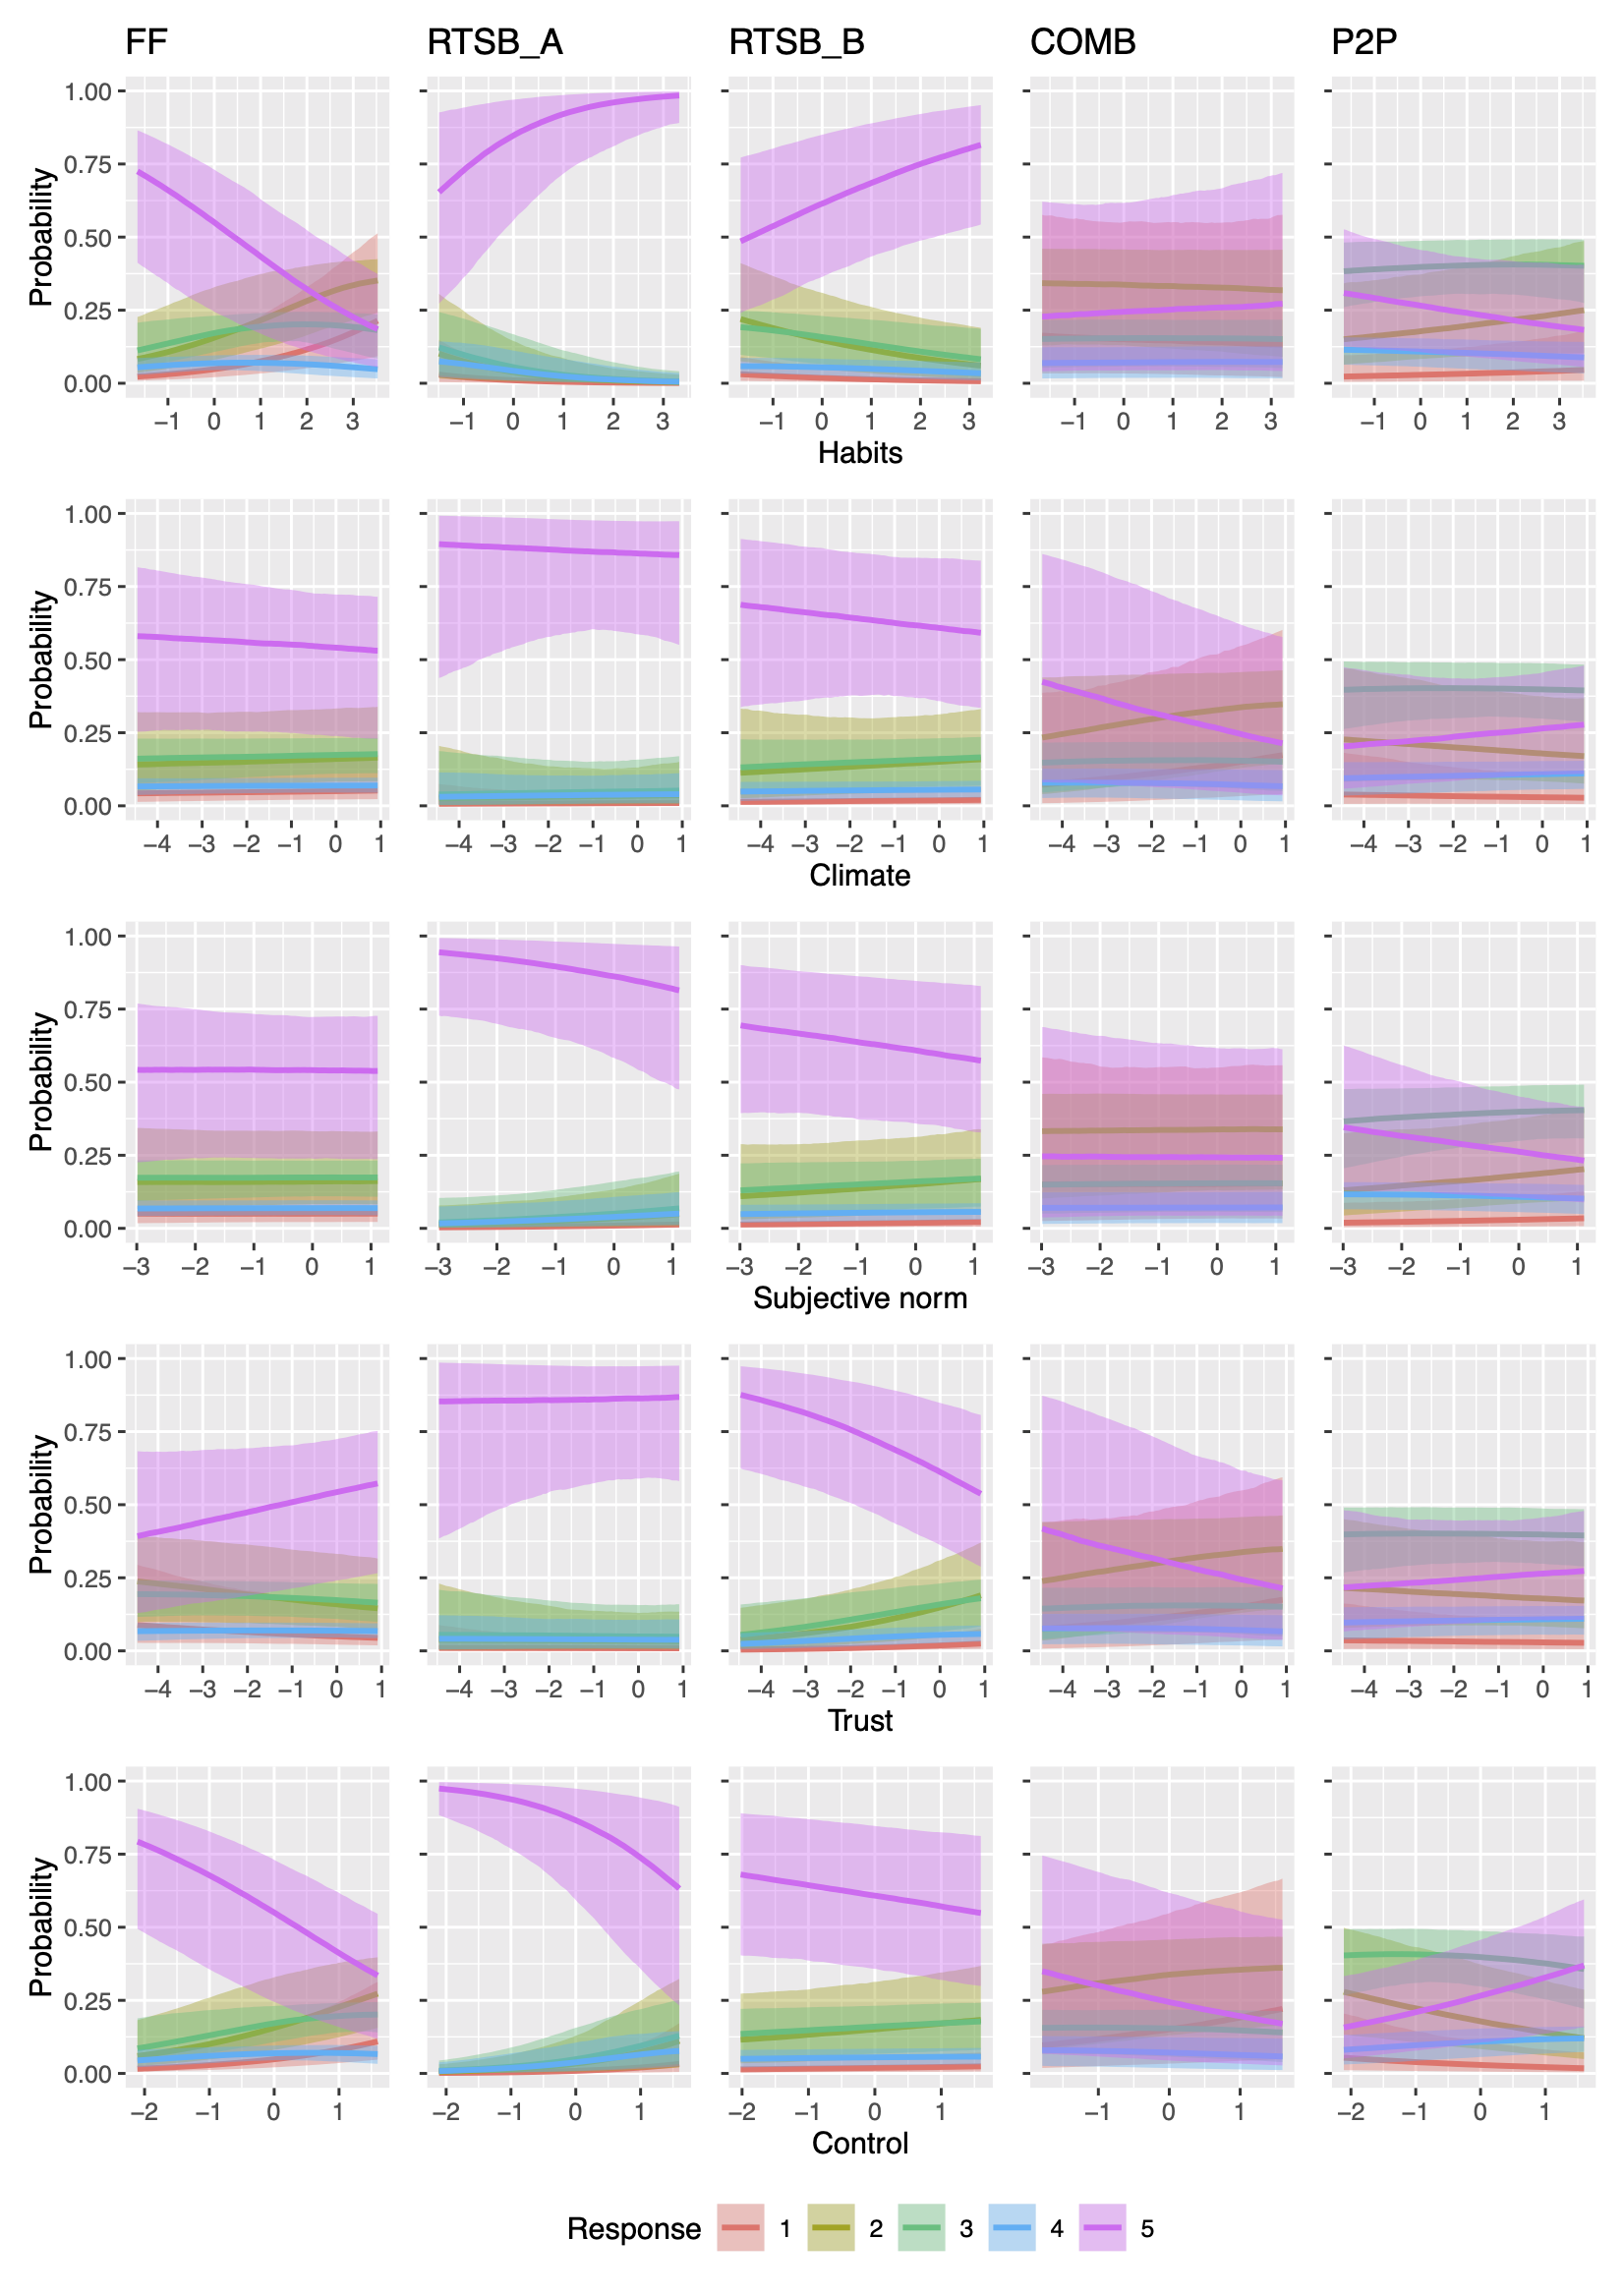
The first step is to generate each plot individually, as you want them to look like. E.g. for the first plot (top-left). The mm_f is the name of the brms model.
habits_ff <- plot(conditional_effects(m_ff, effects="fa_habits",categorical = T))[[1]] +
  coord_cartesian(ylim = c(0,1)) +
  labs(x="Habits",
       title = "FF",
       fill = "Response",
       colour = "Response")+
  theme(axis.title.x=element_blank())
To remove the text labels in the x and y axis, as well as the title of some figures, I removed when plotting each one individually (using element_blank() in the theme). E.g.:
subjective_rtsba <- plot(conditional_effects(m_rtsba, effects="fa_subj",categorical = T))[[1]] +
  coord_cartesian(ylim = c(0,1)) +
  labs(x="Subjective norm",
       fill = "Response",
       colour = "Response")+
  theme(axis.title.x=element_blank(),
        axis.text.y = element_blank(),
        plot.title = element_blank(),
        axis.title.y=element_blank())
We do that for every plot and in the figure (lots of copy paste). Then we assemble each variable individually with patchwork. I used plot_layout(nrow=1) to make sure we have only 1 row.
habits <- (habits_ff + habits_rtsba + habits_rtsbb + habits_comb + habits_p2p ) +
    plot_layout(nrow=1)
After doing this for every variable (Habits, Climate, Subjective norm, Trust and Control) we can assemble these five panels in a single figure also with patchwork. I used the options collect to have only one legend and position it in the bottom.
panel <- (habits / climate/ subjective / trust /control) +
    plot_layout(guides = "collect") &
    theme(legend.position = 'bottom')
I exported everything as pdf A4 figure using the export buttom in the plots panel in RStudio.
I hope that helps others when creating complex but reproducible figures in R (as opposed to gluing them in Photoshop =D).